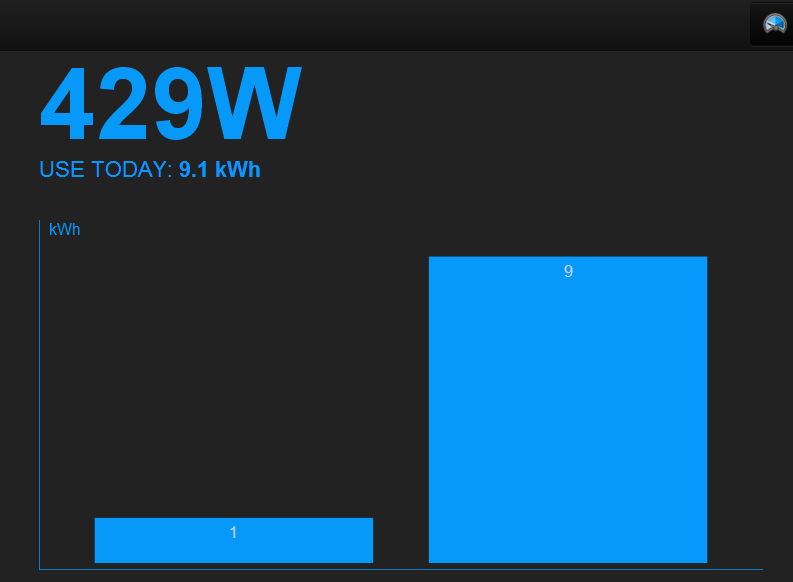
Ver 8.3.5 running on a Raspberry Pi.
Just noticed that the bar graph data displayed in 'My Electric' is yesterday's total and not today's!

now comparing that with the 'bar graph feed' feed, you can see that today's total is about 5kwh/d, and 9kwh/d was from yesterday.
_3.png)
My Raspberry Pi is set to the correct timezone, and $ date displays the correct time & date.
Timezone is set OK in emoncms too.
Paul
Re: My Electric displaying wrong bar graph data (Sorted)
I've been having similar 'locale' issues too.
Developers: when exactly does the 'd' in kWh/d roll over?
It's definitely not at my midnight.
Jonathan
Re: My Electric displaying wrong bar graph data (Sorted)
Glad someone else has brought this up as I am seeing the same thing (downunder in NZ).
Re: My Electric displaying wrong bar graph data (Sorted)
Should be fixed now, tested here on a kwh/d feed and the last day now shows ok.
To get correct data for different timezones the easiest way to do this at the moment is to create a 'power to kwh' processor to create an ever increasing watt-hour feed and then use the myelectric kwh elapsed option.
Or use the emontx firmware that calculated watt hours elapsed on the emontx which is better than using the power to kwh processor. https://github.com/openenergymonitor/emonTxFirmware/tree/master/emonTxV3...
Re: My Electric displaying wrong bar graph data (Sorted)
Working OK here now. Thanks.
Paul
Re: My Electric displaying wrong bar graph data (Sorted)
Hi Trystan,
I'm still having the same issue. I created an incrementing Wh counter as suggested, but I'm still not seeing My Electric rolling over at midnight.
When you say 'should be fixed now' did you mean the public hosted emoncms, or have you made a git commit to correct the issue only in the code base for locally hosted installs?
And is general timezone support on the roadmap, for us power monitoring Kiwis living in the future?
Thanks,
Jonathan