Archived page - for new setup overview see home energy monitor build step 5
Emoncms overview
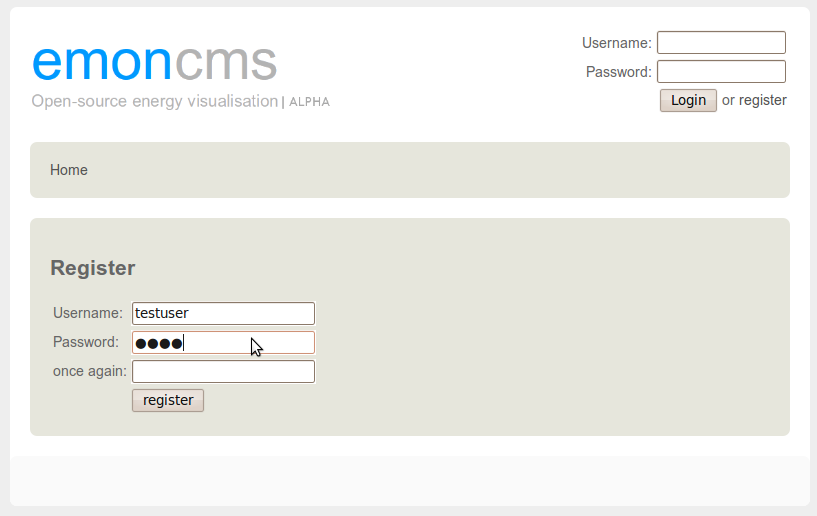
Create an account
Emoncms has multi-user functionality built in, so the first step after installation is to create/register your account via the GUI.
Inputs, input processing and feeds
There are 3 parts to the flow of sensing data in emoncms. Rather than just log incoming data straight away, the idea is to have the option to process this input data as it comes in and then log/store it.
- Inputs
- Input processing
- Feeds
At the moment using input processing you can:
- Multiply the input by a scalar
- Add an offset
- Multiply the input with another input
- log the input to a feed
- convert a power input to kwh per day and log to a feed
- convert a kwh increment to kwh per day
and log to a feed - count the length of time an input is 1 or 0 per day (useful for counting the length of time a solar HW pump is on for)
- convert accumulated kwh updates to kwh per day and log to a feed
See full input processing descriptions here.
1) Sending a JSON string
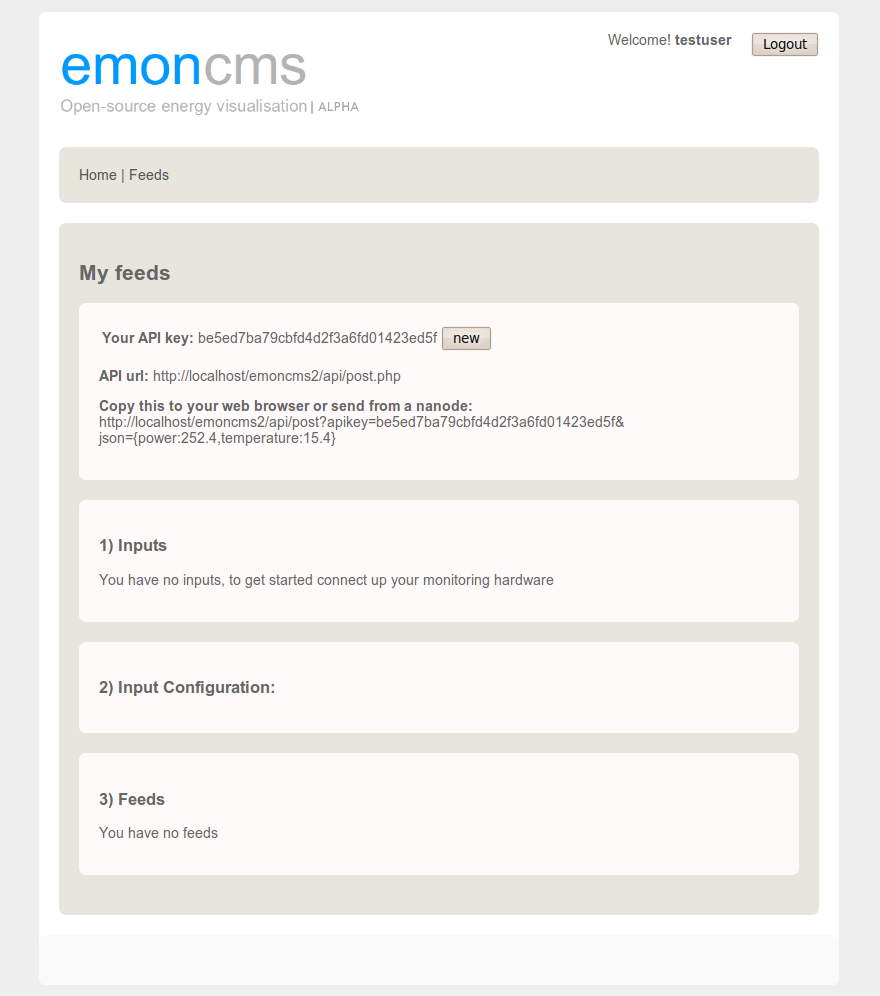
The first step is to send some data to emoncms, this is done by sending a HTTP request with the data in the url to the emoncms API. For example:
emoncms/api/post?apikey=YOURAPIKEY&json={power:200.2}The data needs to be sent in json form with a tag for the variable you want to send and the variable value, for example: {testA:200} or 2 variables {testA:200,testB:400} and so on for as many variables as you want to send.
You also need to include your apikey that can be found at the top of your feeds page.
Try copying the example URL at the top of the feeds page into your browser to see this stage in action.
2) The variables should now appear in inputs:
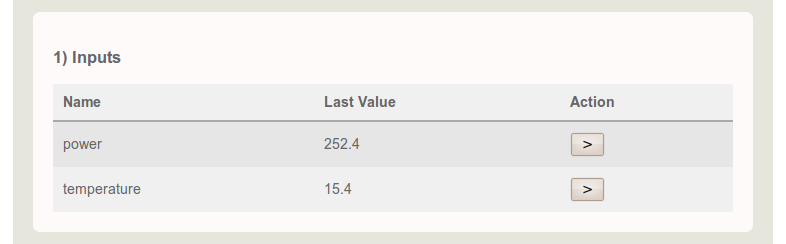
3) Click on the arrow to bring up the input configuration box.
Lets create a log of the input (a feed). Click on the drop down menu and select log and in the arg edit box enter a name for the log you would like to create. Then click add.
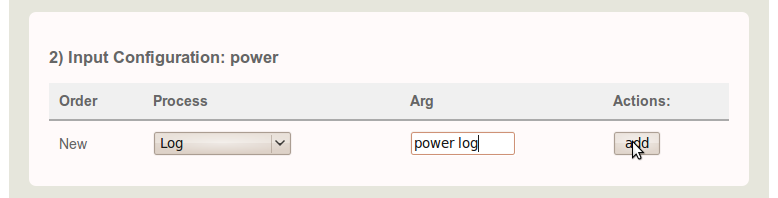
4) The feed should now appear in the feeds list and the data will be logging.
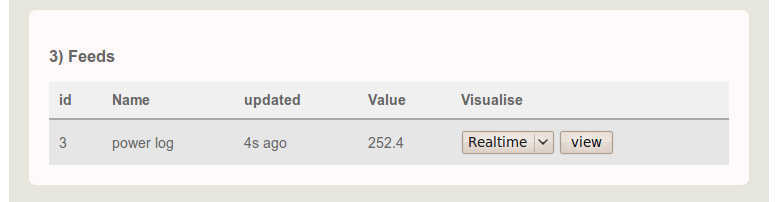
5) Standard Visualisations
Once you have been logging for a little while, click on the drop down menu to see your feed visualised. The following options are available:
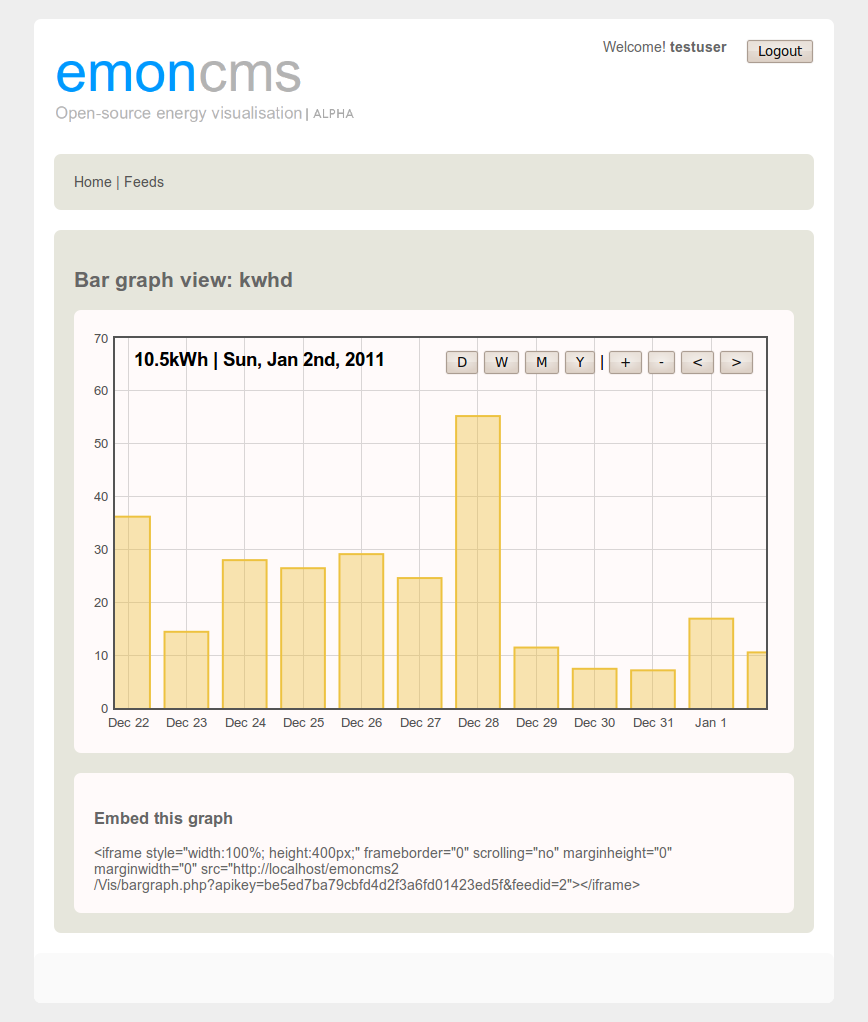
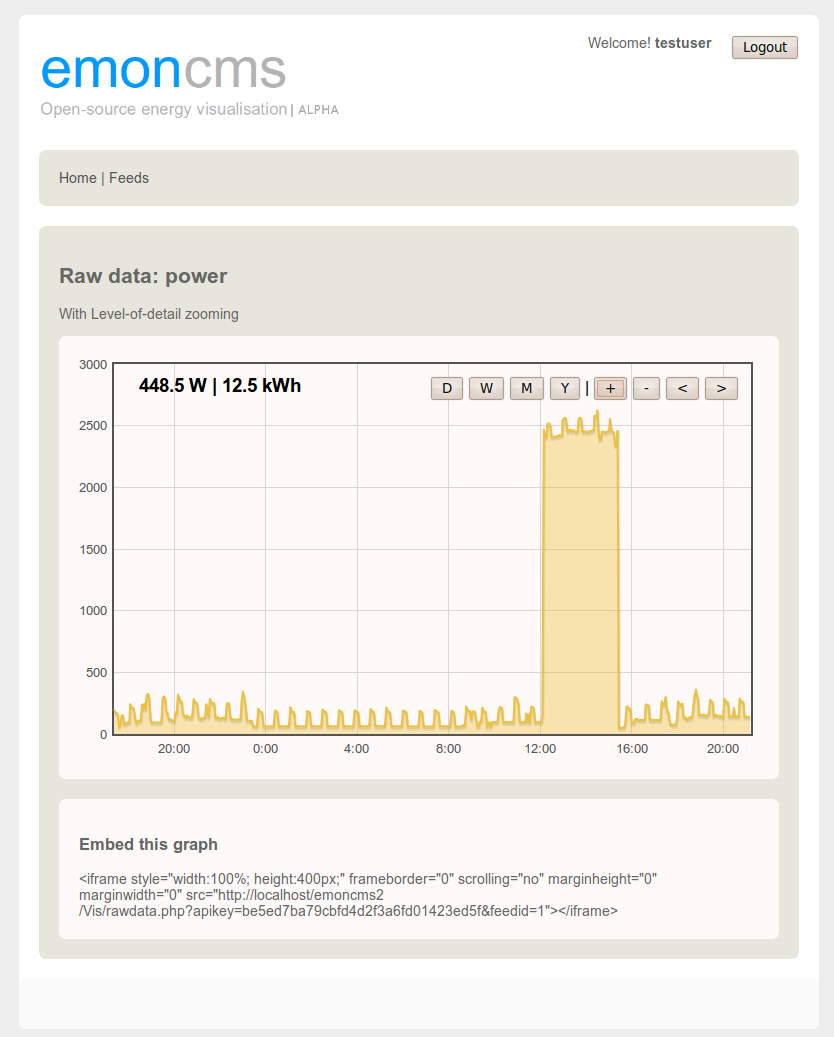
These visualisations can also be embedded outside of emoncms using the embedd link.
6) Get at your data for external use via the API using the following API call:
emoncms/api/getfeed?apikey=YOURAPIKEY&feedid= &start= &end= &resolution=
Re: Emoncms overview
Im not sure why this works but it seems that the same parameter (name="form" value="...) in a different form (the graph selector form) was causing the problem, luckily the parameter isnt actually needed in the other form so we can just remove it.
If you go to feedComponent.php and remove line 118, this line:
$out .= '<input type="hidden" name="form" value="3">';
That should solve the problem. All the best Trystan