I was just curious if there was a way that we could scale the visualizations so that data points that don't vary much can show the variations in greater detail?
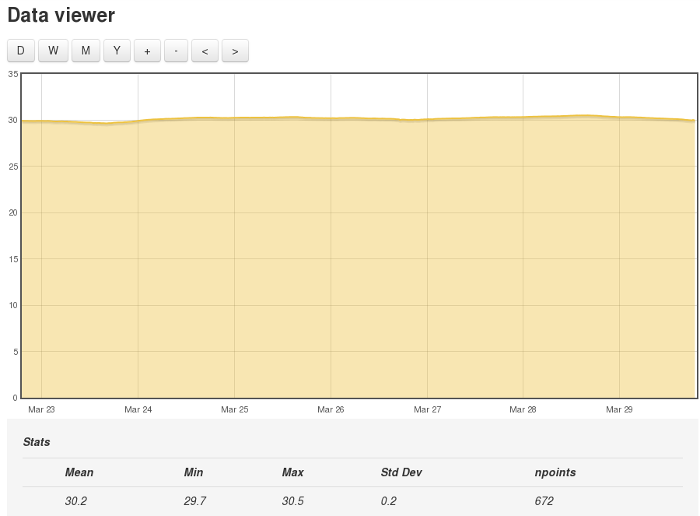
The point I have in mind is monitoring barometric pressure, which has a very small variation:
Moved image from 3rd party site to OEM.
Please don't link to images on third party sites. Upload your images directly to OEM.
Moderator, BT
Re: Scaling of visualizations?
You could subtract 1013.25 [Edit: 29.92 for you Colonials] somewhere along the line, to give the deviation from standard pressure.
Re: Scaling of visualizations?
But, I can see being able to specify a fixed scale on a graph as being useful in other cases.
E.g. when looking at a kWh graph and scrolling through time, the scale keeps changing depending on the values in the current period, which can sometimes make it harder to find what you're looking for. Other times I like it adjusting to make best use of the space!
Re: Scaling of visualizations?
It sounds as if you want something like most spreadsheet graphs offer: auto, or manual with defined upper and lower limits.
Re: Scaling of visualizations?
Yep, I think that would be awesome :)
I guess if worse came to worst, I could always multiply the values by 1000 when they're recorded by the software, so that way they'd really stand out ;)
Re: Scaling of visualizations?
"I could always multiply the values by 1000 when they're recorded by the software, so that way they'd really stand out..."
Er,.... NO! Wouldn't the picture still be the same, just the left-hand scale would be different?
I reckon you need to log a feature request with Trystan.
Re: Scaling of visualizations?
The graph can auto scale if the fill parameter is not set, I've set fill to false on the more recent version of emoncms. But on the low-write branch its still true: https://github.com/emoncms/emoncms/blob/low-write/Modules/vis/visualisat...
Shall I change it to false? @chrismyers81 are you running the current emonpi image as shipped?
Re: Scaling of visualizations?
It would allow you to see the variation better but still has the issue of not being a fixed scale.. that would need to be an additional feature. It would be a good one to add to the new graph module.
Re: Scaling of visualizations?
My big thought with multiplying x1000 was that instead of the difference between like 29.97 and 30.01, it'd be 2997 vs 3001 - eg., hopefully showing more of a difference between the values :P
But yes, the new feature would be awesome!
Trystan, I'm running emoncms 9.2 (2015.12.11) on an odroid u3 (along with about 30 other things :P)